ブックタイトル教育医学 J.Educ.Health Sci. 第63巻 第3号 通巻 第289号
- ページ
- 10/64
このページは 教育医学 J.Educ.Health Sci. 第63巻 第3号 通巻 第289号 の電子ブックに掲載されている10ページの概要です。
秒後に電子ブックの対象ページへ移動します。
「ブックを開く」ボタンをクリックすると今すぐブックを開きます。
このページは 教育医学 J.Educ.Health Sci. 第63巻 第3号 通巻 第289号 の電子ブックに掲載されている10ページの概要です。
秒後に電子ブックの対象ページへ移動します。
「ブックを開く」ボタンをクリックすると今すぐブックを開きます。


教育医学 J.Educ.Health Sci. 第63巻 第3号 通巻 第289号
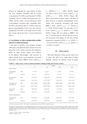
Change in Oral Antimicrobial Peptides and Neuroendocrine Response by Intense Exercisesession, as indicated by main effects of time(all four variables; P<0.001) and of session(concentration; P = 0.002, secretion ratio; P = 0.004,osmolality ratio; P = 0.003, and protein ratio; P =0.006), and by a time×session interaction effect(concentration, secretion ratio, osmolality ratio;P<0.001, and protein ratio; P = 0.002). Likewise,plasma norepinephrine levels were also elevatedsignificantly (P<0.001 in the main effect of timeand session and in the time×session interactioneffect).4. Correlations of saliva antimicrobial profilesand stress-related hormonesAll values ofΔAUCIgA were negative becausesaliva IgA concentrations after exercise were lessthan those in the resting session in all volunteers,while all otherΔAUC values were positivein all subjects. Interestingly, total increases insaliva cortisol levels were negatively associatedwith those in saliva HBD-2 levels (ΔAUCcortisolvs.ΔAUCHBD-2: r = - 0.859, P<0.01, Figure2A) and in saliva LL-37 levels (ΔAUCcortisol vs.ΔAUCLL-37: r = - 0.838, P<0.01, Figure 2B).These observations contrast starkly with those oftotal increases in plasma norepinephrine levels,which were positively associated with salivaHBD-2 levels (ΔAUCnorepinephrine vs.ΔAUCHBD-2:r = 0.854, P<0.05, Figure 3A) and saliva LL-37levels (ΔAUCnorepinephrine vs.ΔAUCLL-37: r = 0.880,P<0.01, Figure 3B). In contrast to HBD-2 andLL-37, the decreases in salivary IgA levels werenot associated with changes in any stress-relatedparameters examined (ΔAUCcortisol vs.ΔAUCIgA: r= 0.210, P=0.6702,ΔAUCnorepinephrine vs.ΔAUCIgA: r= 0.540, P = 0.2267).Ⅳ.DiscussionThe main objectives of the present study wereto assess the effect of a single bout of highintensityexercise on salivary levels of innateTABLE 3 Time course of stress-related parameters during resting and exercise sessions.t (min)0 60 120 180Saliva cortisolConcentrationRest1.3±0.51.4±0.41.3±0.41.2±0.4(ng ml -1 )***Exercise2.1±1.15.8±2.2†††3.4±1.3†2.5±1.3Secretion ratioRest1.97±0.972.18±0.972.03±0.831.80±0.78(ng min -1 )***Exercise3.59±2.548.79±3.80†††5.41±2.43†4.01±2.34Osmolality ratioRest0.016±0.0060.018±0.0050.016±0.0040.015±0.003(ng mOsmol -1 )***Exercise0.025±0.0130.064±0.020†††0.036±0.0120.027±0.013Protein ratioRest1.69±0.971.90±0.881.73±0.721.50±0.72(ng mg -1 )***Exercise2.21±1.214.23±1.48†††3.32±1.54†2.54±1.39Plasma norepinephrineConcentrationRest0.19±0.050.17±0.060.16±0.040.16±0.05(ng ml -1 )**Exercise0.20±0.071.48±0.27†††0.22±0.060.22±0.06All values are described as mean±SD. Analysis was performed by two-way ANOVA for repeated measures.With regard to saliva cortisol, there were significant main effects of time (all four variables; P<0.001) and of session (concentration; P=0.002, secretion ratio; P=0.004,osmolality ratio; P=0.003 and protein ratio; P=0.006) and the time×session interaction effect (concentration, secretion ratio, osmolality ratio; P<0.001 and protein ratio;P=0.002). Similarly, significant main effects of time (P<0.001) and session (P<0.001) and the time×session interaction effect (P<0.001) were observed in plasma norepinephrinelevels.* P<0.05, ** P<0.01; resting vs. exercise session.†P<0.05,†††P<0.001; vs. t=0.? 234 ?